

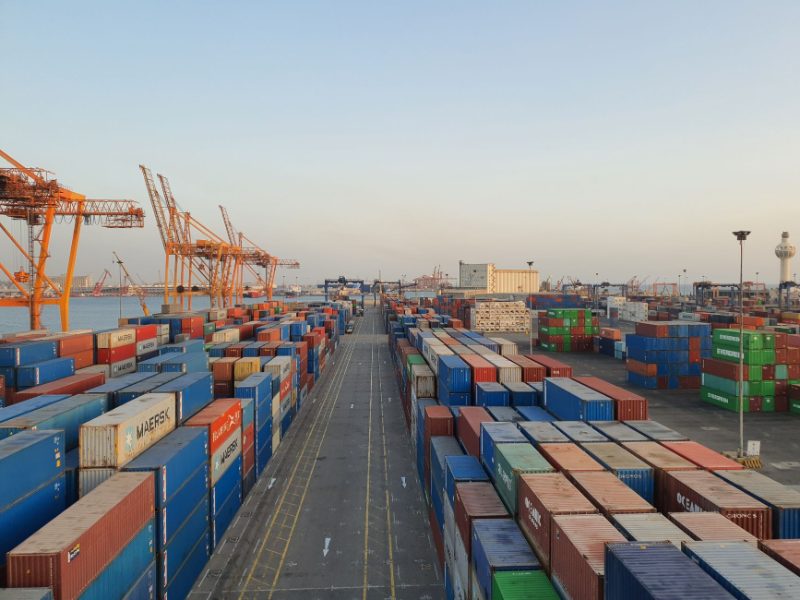
Global trade policy activity has nearly doubled its 2024 level and now sits roughly 25% above its 2025 average, according to an updated Trade Policy Activity Index jointly developed by the World Trade Organization and the International Monetary Fund. The index reached its highest point since data collection began after the 2008 global financial crisis, signalling that tariff increases, import bans, and quantitative restrictions are being imposed at a record pace worldwide.
The updated TPA Index, released by the WTO on 23 July 2026, measures trade policy activity across major economies using a systematic count of new restrictive and liberalising measures. Economists at both institutions built the index after identifying a need for a real-time gauge of trade tensions, distinct from slower-moving trade volume statistics.
What Is Driving the Record Rise in Trade Policy Activity?
The report attributes the surge overwhelmingly to restrictive measures, chiefly tariff increases, import bans, and quantitative restrictions, which have climbed more steeply than any other category through 2025 and into 2026. Averaged over January-May 2026, activity ran at nearly twice the 2024 pace, with the WTO-IMF nowcast for the months through June 2026 pointing to a further increase despite some signs of slowing earlier in the year. The pattern reflects escalating tariff actions by the United States, retaliatory and defensive measures from major trading partners, and a broader shift toward protectionism among large economies.
What Do Economists Say About the Trend?
WTO and IMF economists behind the index caution that a sustained rise in restrictive trade measures typically dampens global GDP growth over a two-to-three year horizon by raising input costs and disrupting established supply chains. Trade policy researchers note that the current spike is unusual in both its speed and its concentration among the world’s largest economies, rather than being spread evenly across smaller trading nations, which historically has made downturns in global trade activity harder to reverse quickly.
Market and Trade Reaction
Currency and commodity markets have shown increased volatility in tandem with the rise in trade policy activity, with several emerging-market currencies, including the rupee, trading under pressure as investors price in the risk of further tariff escalation. Export-oriented sectors across Asia, including electronics, textiles, and pharmaceuticals, are being watched closely by analysts for signs of order deferrals as buyers wait to see where new restrictions land.
What Happens Next?
The WTO and IMF are expected to continue publishing updated TPA Index readings on a rolling basis, giving policymakers and businesses an earlier warning signal than traditional trade statistics allow. Trade ministries in major exporting nations, including India, are likely to use the index alongside their own bilateral tariff trackers when deciding how aggressively to negotiate exemptions or retaliatory measures over the coming quarters.
Frequently Asked Questions
What is the WTO-IMF Trade Policy Activity Index?
It is a joint WTO-IMF index that measures the pace of new trade policy actions worldwide, including tariff increases, import bans, and quantitative restrictions, updated on a rolling basis.
How much has global trade policy activity risen in 2026?
Averaged over January-May 2026, trade policy activity ran at nearly twice its 2024 level and about 25% above its 2025 average, the highest since the index’s data series began.
What is mainly driving the rise in trade policy activity?
Restrictive measures, particularly tariff increases, import bans, and quantitative restrictions, are the largest contributors to the index’s climb through 2025 and 2026.





Leave a comment