

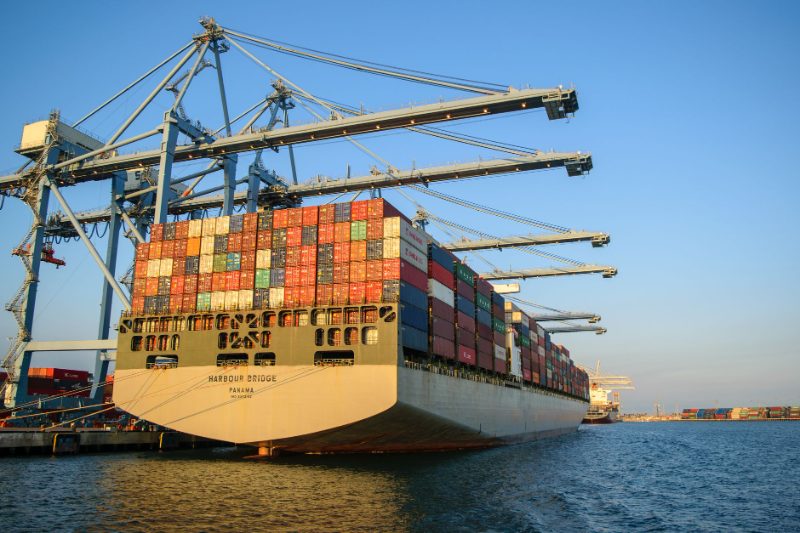
Global goods trade reached approximately US$13.7 trillion in the first half of 2026, up 12.5% from the same period in 2025, according to the UNCTAD Global Trade Update. A significant share of this increase reflects higher prices rather than stronger trade volumes, meaning the headline figure is only partly a story of more goods physically moving across borders.
The report, published by UNCTAD in July and August 2026, highlights how demand for AI infrastructure, digital technologies, and electric mobility drove strong growth in technology-intensive goods during the first quarter of 2026, even as overall trade value growth was partly price-driven rather than purely volume-driven. The findings come from UNCTAD, with additional reporting from Yahoo Finance and the Bundesbank. Together, the data offer one of the clearest pictures yet of how AI-related demand is reshaping global goods trade patterns in 2026.
Which Sectors Grew Fastest in Global Trade During 2026?
Technology-intensive goods led growth in Q1 2026: critical minerals trade rose 38%, semiconductors climbed 25%, batteries increased 15%, ICT products grew 14%, and electric vehicles rose 11%. These gains reflect surging global demand tied to AI infrastructure build-out, digital technology adoption, and the ongoing shift toward electric mobility. The scale of the critical minerals and semiconductor gains, in particular, points to how tightly global goods trade is now linked to the buildout of AI-related computing and manufacturing capacity worldwide. Battery and electric vehicle growth, while smaller in percentage terms, reflect the continued expansion of electric mobility supply chains across multiple regions.
How Are Analysts Interpreting the Global Goods Trade Data?
Trade economists note that because a significant share of the 12.5% year-on-year increase in global goods trade reflects higher prices rather than stronger volumes, the headline figure should be read carefully rather than taken purely at face value. Analysts generally view the sector-level volume growth in critical minerals, semiconductors, and batteries as the more meaningful signal of underlying demand strength tied to AI infrastructure and electrification trends, distinct from broader price effects seen across other goods categories in the same period.
Market and Trade Reaction
The trade growth data comes alongside several major trade agreements concluded in 2026 that do not involve the United States. The EU-India Free Trade Agreement, concluded January 27, 2026, is expected to double EU exports to India by 2032 by eliminating or reducing tariffs on 96.6% of traded goods by value; India will cut EU car tariffs to 40% from as high as 110%, eventually falling to 10% over time. Separately, the EU-Mercosur Agreement, signed January 17, 2026 and provisionally applied from May 1, 2026, covers a trade zone of more than 700 million people. Together, these deals point to expanding non-US trade corridors even as global goods trade value climbs to $13.7 trillion for the first half of the year, suggesting trade diversification is accelerating alongside technology-driven demand.
The technology-intensive gains also raise questions about how supply chains for critical minerals and semiconductors will adapt to sustained double-digit demand growth. Producers and exporters of these inputs, along with battery and electric vehicle manufacturers, are likely to remain central to global goods trade figures for the remainder of 2026 as AI infrastructure investment continues at scale across major economies.
What Happens Next?
With global goods trade at $13.7 trillion for H1 2026, trade analysts will be watching whether the technology-driven sector growth — led by critical minerals, semiconductors, and batteries — continues into the second half of the year. Also worth monitoring is how quickly the EU-India and EU-Mercosur agreements translate into measurable trade flow increases as implementation proceeds through 2026 and beyond, and whether price-driven or volume-driven growth dominates the second-half trade figures as the year progresses.
Monitoring these dynamics will matter for exporters, investors, and policymakers alike, since the interplay between price effects and genuine volume growth shapes how global goods trade figures should be interpreted heading into 2027.
Frequently Asked Questions
How much did global goods trade grow in H1 2026?
Global goods trade reached approximately $13.7 trillion in the first half of 2026, up 12.5% from the same period in 2025, according to UNCTAD’s Global Trade Update.
Was the increase in global goods trade driven by prices or volumes?
A significant share of the increase reflects higher prices rather than stronger trade volumes, meaning the headline growth figure partly reflects price effects rather than purely higher shipment quantities.
Which major trade deals were concluded in 2026 outside the US?
Two major agreements were concluded: the EU-India Free Trade Agreement (concluded January 27, 2026) and the EU-Mercosur Agreement (signed January 17, 2026, provisionally applied from May 1, 2026), covering a combined trade zone of over 700 million people.









Leave a comment