

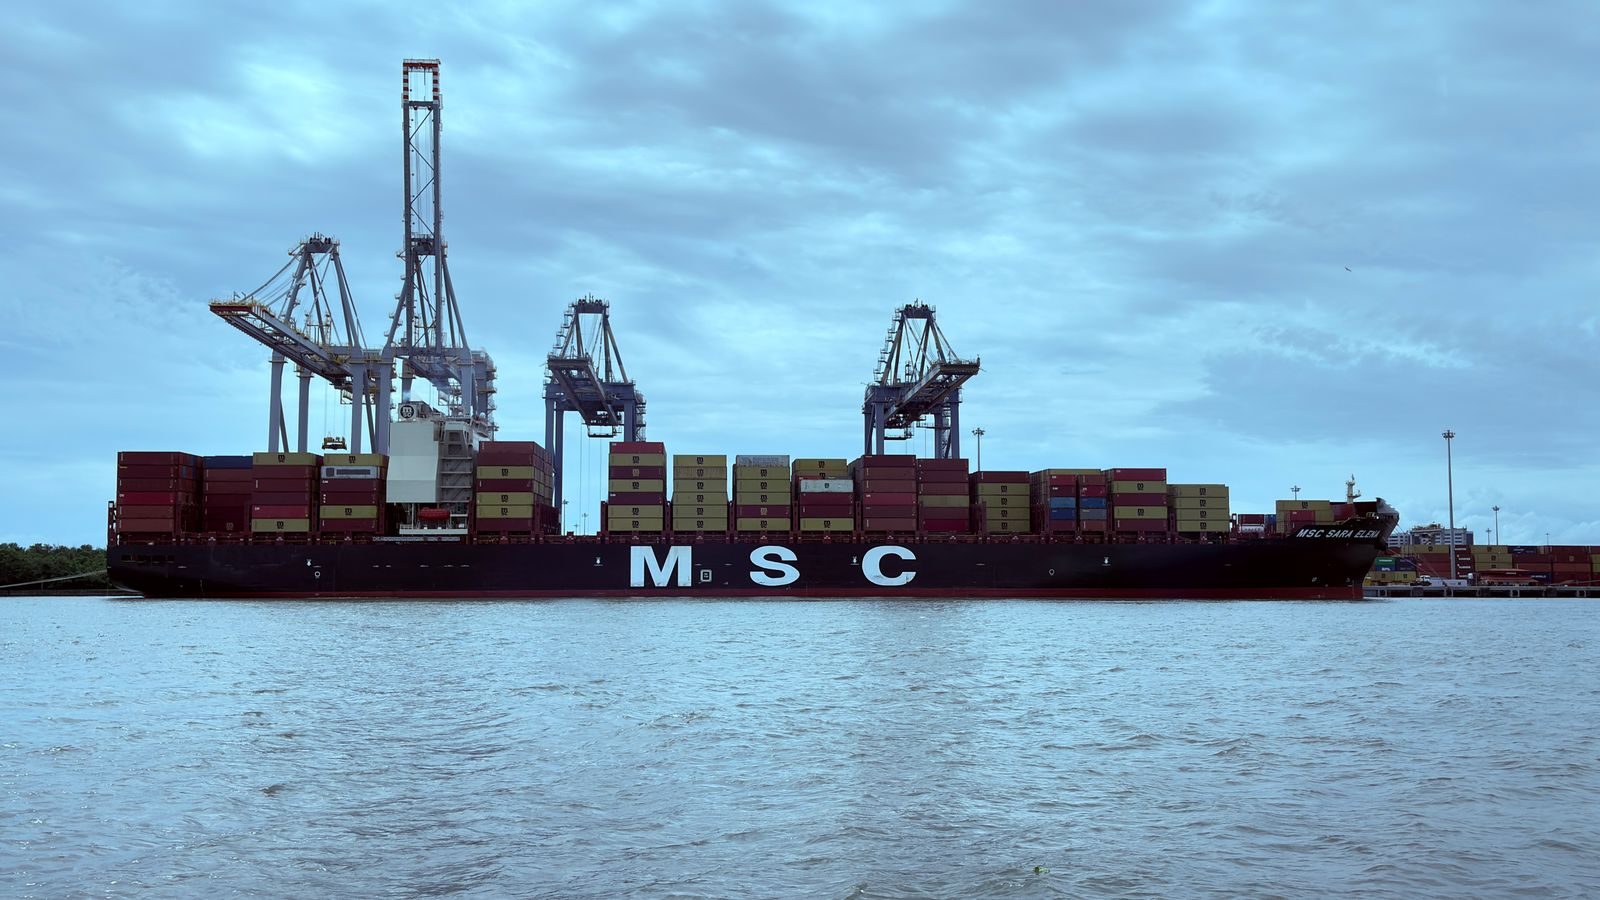
India exports to Africa grew 44% to US$ 31.42 billion in April-September 2026-27, the fastest growth among all regions, according to a government backgrounder released on 21 November 2026. India exports to Africa rose from US$ 21.87 billion in the same period a year earlier, while exports to Asia crossed US$ 100 billion.
The data was published by PIB Research using Ministry of Commerce and Industry figures. It shows India’s merchandise exports grew across every major region in the first half of the financial year, with engineering goods, electronic goods and petroleum products among the biggest categories.
How did India’s exports grow by region in H1 FY27?
- Asia: up 21% from US$ 85.84 billion to US$ 103.84 billion.
- Africa: up 44% from US$ 21.87 billion to US$ 31.42 billion.
- Americas: up 13% from US$ 59.30 billion to US$ 66.82 billion.
- Europe: up 8% from US$ 47.06 billion to US$ 51.04 billion.
- CIS & Baltics: up 7% from US$ 3.14 billion to US$ 3.36 billion.
Africa: petroleum and engineering goods lead
South Africa remained the largest African market at US$ 5.69 billion, up 52%. Exports to Tanzania reached US$ 4.77 billion (up 121%) and Kenya US$ 3.63 billion (up 101%). Exports to Egypt rose 73% to US$ 3.25 billion, while Nigeria and Mozambique reached US$ 1.78 billion and US$ 1.31 billion.
Petroleum products were the largest contributor to Africa at US$ 11.85 billion, up 137%. Engineering goods reached US$ 7.48 billion, up 29%, and drugs and pharmaceuticals stood at US$ 2.58 billion.
Asia, Americas and Europe: the key markets
In Asia, China (US$ 11.39 billion, up 36%) and Singapore (US$ 11.07 billion, up 103%) were the largest markets. Malaysia reached US$ 5.58 billion (up 83%) and Hong Kong US$ 5.12 billion (up 37%). Engineering goods to Asia were US$ 27.47 billion (up 22%), petroleum products US$ 17.05 billion (up 28%) and electronic goods US$ 10.54 billion (up 91%).
In the Americas, the United States took US$ 50.80 billion, up 11%. Brazil (US$ 4.33 billion), Mexico (US$ 3.45 billion) and Canada (US$ 2.67 billion) grew 14%, 26% and 18% respectively. Engineering goods to the region were US$ 19.19 billion (up 21%) and electronic goods US$ 15.35 billion (up 23%).
In Europe, the UK was the largest market at US$ 7.32 billion, followed by Germany at US$ 6.34 billion (up 12%). Exports to Spain rose 45% to US$ 4.68 billion, Italy 25% to US$ 4.55 billion and Turkey 72% to US$ 3.63 billion. Electronic goods to Europe rose 52% to US$ 5.44 billion. Russia was the largest CIS market at US$ 2.39 billion, up 7%.
Market and Trade Reaction
No comment from exporter bodies on the regional data was found at the time of writing. The backgrounder itself said the trends point to “a geographically and product-wise diversified expansion” of India’s merchandise exports.
What Happens Next?
The figures cover April-September only. Monthly trade data from the Ministry of Commerce and Industry will show whether the regional pattern holds in the second half of FY 2026-27.
Frequently Asked Questions
How much did India export to Africa in H1 FY27?
US$ 31.42 billion in April-September 2026-27, up 44% from US$ 21.87 billion a year earlier.
Which region is India’s largest export market?
Asia, with exports of US$ 103.84 billion in April-September 2026-27, up 21%.
Which African countries saw the fastest growth?
Among named markets, Tanzania (up 121%), Kenya (up 101%), Egypt (up 73%) and South Africa (up 52%).
Source: Press Information Bureau backgrounder “India’s Expanding Regional Exports” (Ministry of Commerce and Industry data), 21 November 2026.












Leave a comment